top of page
Projects
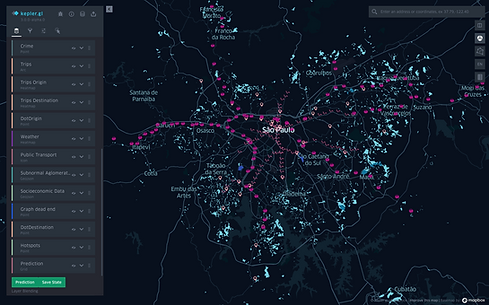
We analyze visually multi-attribute data through layer toggling, spatial, and time filtering.

A visual analytic tool designed to explore origin and destination data. Ordena is built upon a simple and intuitive scatter plot where the horizontal and vertical axes correspond to origins and destinations, respectively.
.png)

CityHub, a library to handle multiple urban datasets. Specifically, CityHub integrates distinct urban data types in a layer-based architecture that considers four different types of layers. The integrated data is preprocessed to a common spatial domain: the set of nodes of a city street graph.
bottom of page